![]() TRACK
TRACK
Unlock Actionable Insights with Track
Track empowers city, county, and public sector leaders to monitor performance, benchmark impact, and spot opportunities - all from one intuitive analytics platform.


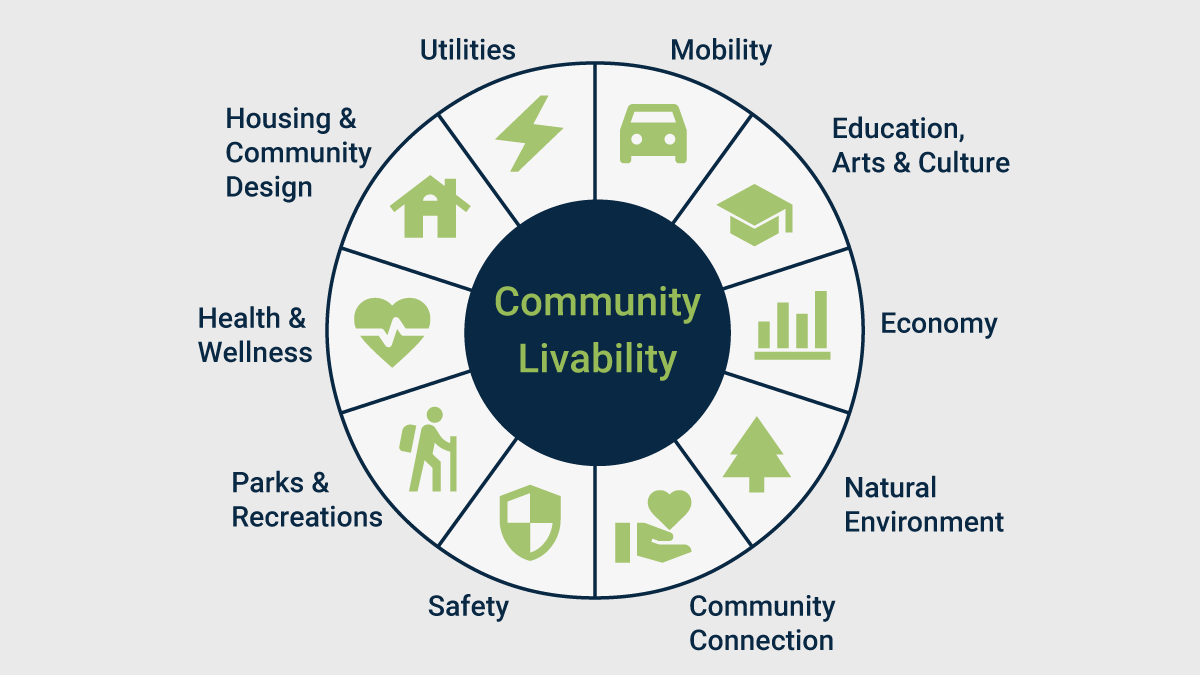
Community Livability Snapshot (CLS)
Get a quick, visual overview of your community’s quality of life. The Community Livability Snapshot simplifies complex data into easy-to-understand metrics across key domains, helping you quickly identify strengths and areas for improvement. This allows you to prioritize what to focus on, with community input guiding what matters most.

Overview Dashboard
Dive into your community’s performance with the Overview Dashboard. This feature helps enables you to efficiently grasp essential data across multiple sectors, allowing you to monitor trends, assess progress, and make data-driven decisions with confidence.

Domain Dashboards
User-friendly Domain Dashboards, for local and National data, provide tailored insights for each key domain, highlighting metrics and trends for that sector, with configurable benchmarking comparison filters. Quickly link high-level analytics with underlying data points that support them to track progress and make data-driven decisions.

Comparison Groups
Comparison Groups give your city or agency the context it needs to understand where it stands on key metrics of success. By comparing your performance to similar communities, you can identify gaps, celebrate strengths, and make data-driven decisions that lead to better outcomes.

Data for Older Adults
With Data for Older Adults, you can make informed, impactful decisions that create a more inclusive, supportive environment for your senior population. Communities with growing senior populations face unique challenges that require focused attention and data-driven solutions.

NEW!
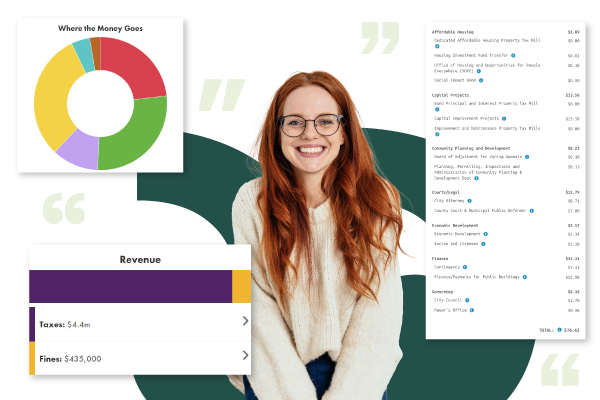
Rethinking Budgeting
Rethinking Budgeting is a structured, data-driven approach that helps local governments transform their budgeting processes.


Unveiling the data source: GPAL explained
Discover how our Polco platform harnesses the power of GPAL (Government Performance Action & Learning) to deliver precise, actionable insights. GPAL integrates diverse data sources helping government leaders better understand their performance metrics and the factors that impact them.

The 10 Community Domains You Should Be Tracking Before Your Next Strategic Plan
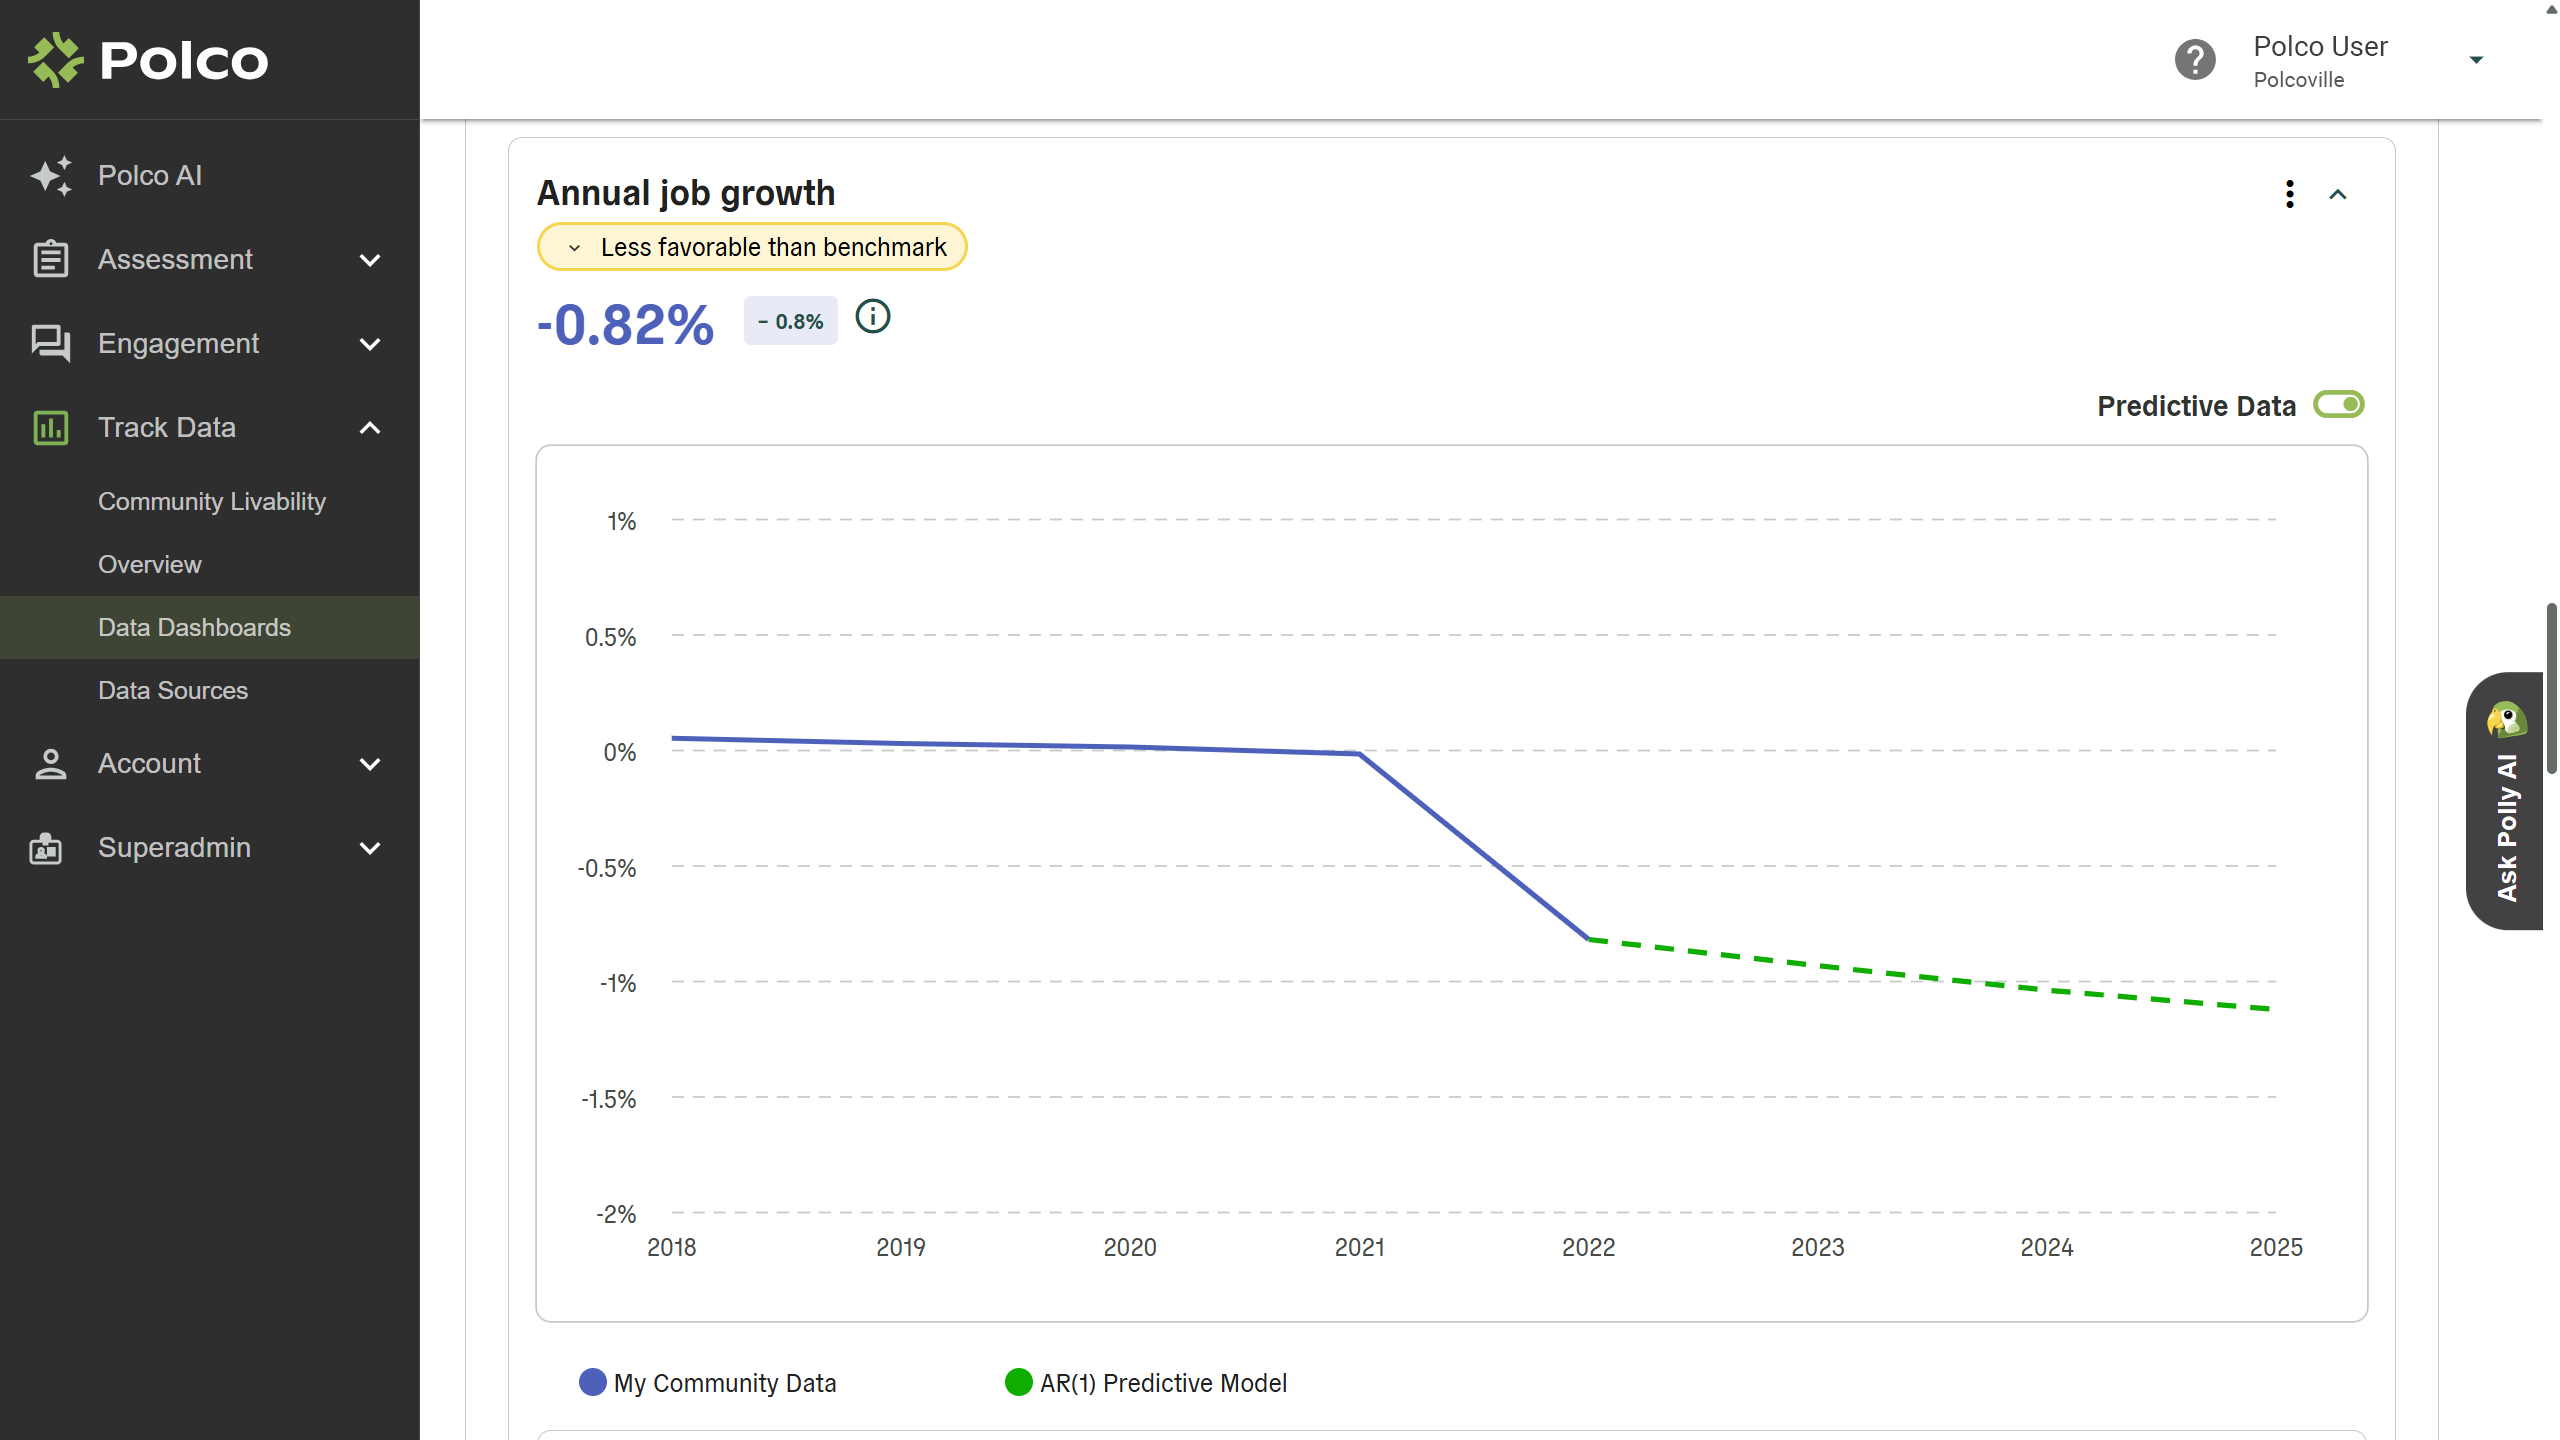
Predictive Benchmarking: Using Data to Anticipate Your Next Revenue Gap
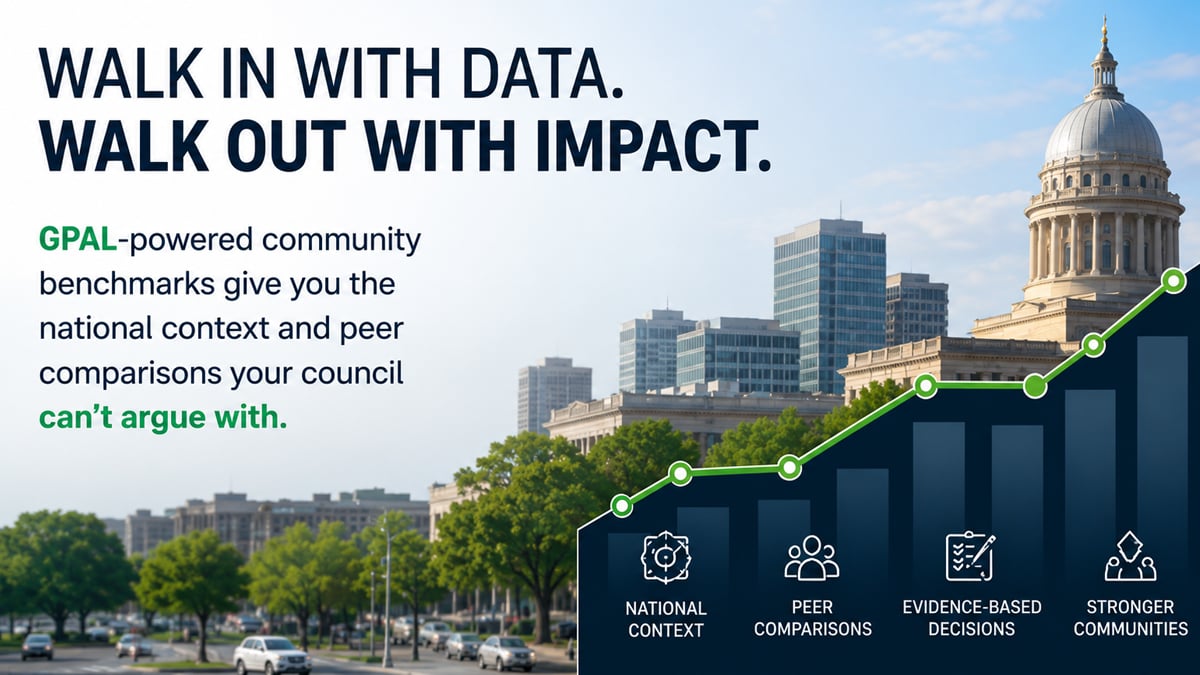
How to Walk Into a Budget Meeting with Data Your Council Can't Argue With

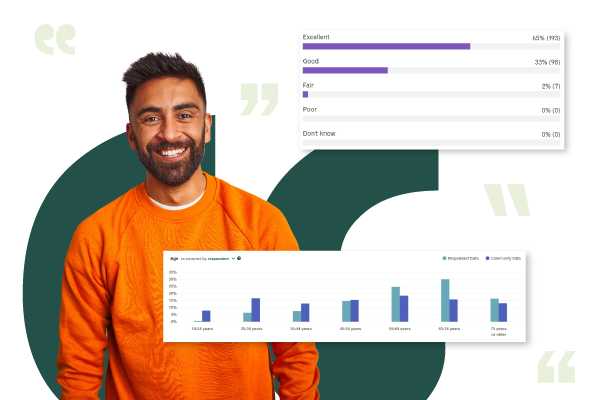
Benchmark Surveys
Get comprehensive insights by comparing your community's performance with national standards.
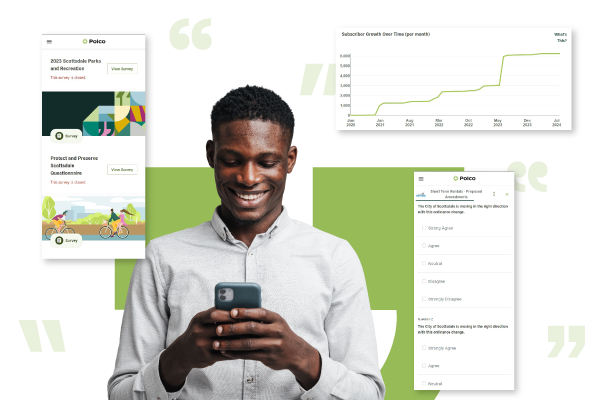
Resident Engagement
Foster constructive civic conversation and active participation through accessible digital platforms.
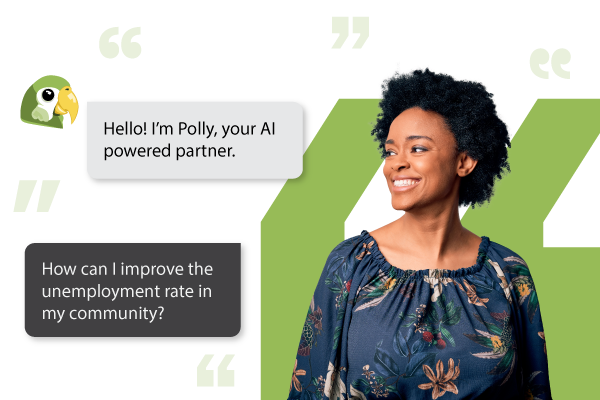
Polco AI
Maximize your impact with insights and guidance from Polco’s advanced Artificial Intelligence capabilities
Simulation Tools
Model potential outcomes of policy decisions with residents to see their impact before implementation.