What are Comparison Groups?
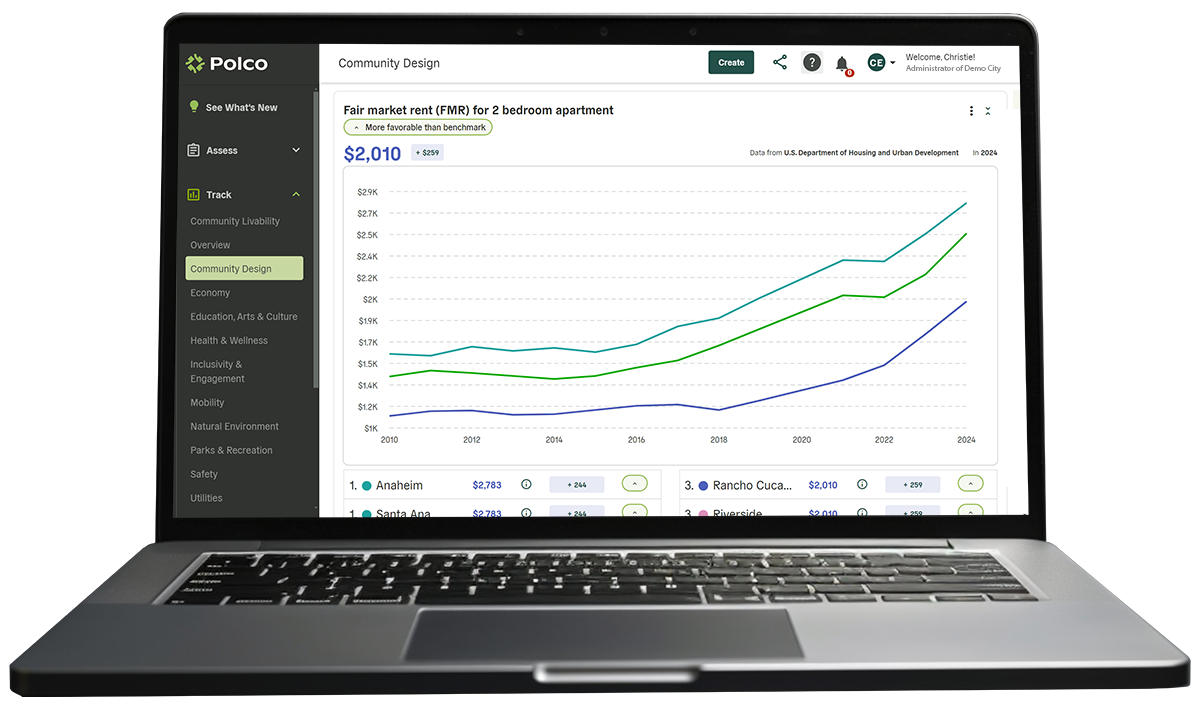
Comparison Groups, in Polco's Track module, provide a data-driven way for communities to evaluate their performance by selecting communities of their choosing to benchmark against. For example, they can select specific communities within the same regional location or budgetary size.
These comparisons are based on standardized metrics gathered through Polco's research and GPAL, ensuring that the data is accurate, relevant, and actionable. Whether you want to compare resident satisfaction, financial performance, or service delivery, Comparison Groups give you the context to understand where your community excels and where it can improve.

Key features of Comparison Groups
Data-driven benchmarking for smarter decisions
Customizable peer comparisons
Tailored Comparison Groups: Select any community, such as peers that closely match your population size, geographic location, or other relevant characteristics to ensure meaningful comparisons.
Flexible Filters: Narrow down Comparison Groups by factors such as income, employment, and housing data to gain a deeper understanding of how your community performs relative to others.
Standardized metrics across communities
Reliable Data: Polco’s data is gathered from standardized surveys and validated research, ensuring that the metrics used for comparison are consistent and accurate across all communities.
Comprehensive Insights: Access detailed data on various performance indicators, from public safety and infrastructure to community engagement, economic vitality, and resident satisfaction.
Visual and easy-to-Use dashboards
Interactive Dashboards: Compare your community’s performance with selected peers through easy-to-understand visual dashboards. Use trendlines to track performance over time.
Instant Reporting: Generate reports that highlight key areas where your community excels and areas where improvements are needed, making it easier to communicate data-driven insights to stakeholders.
Historical data tracking
Track Progress Over Time: See how your community has improved or fallen behind compared to others over time, allowing you to identify trends and make adjustments to policies or resources.
Long-Term Trends: Use historical data to understand whether your community is moving in the right direction and to assess the effectiveness of initiatives and strategies.
Key stakeholder reporting
Actionable Insights: Understand why your community is underperforming or overperforming by comparing context-specific factors, such as regional trends or socio-economic conditions, that impact the metrics you’re tracking.
Inform Policy and Budget Decisions: Use Comparison Groups data to guide policy adjustments, inform budget allocations, and make decisions that are backed by evidence from similar communities.
Experience the benefits of using Comparison Groups
Make data-driven decisions that strengthen your community
Celebrate success and build public confidence
Highlight your community’s strengths and achievements by demonstrating how well you perform compared to others. This builds public confidence and supports your efforts in promoting transparency and accountability.
Identify improvement areas
See how your community measures up against peers and pinpoint specific areas that need attention. Whether it’s public safety, infrastructure, or resident satisfaction, Comparison Groups give you the insights to prioritize and address critical issues.
Support data-backed policy and budgeting
Comparison Groups help you make informed decisions on policy changes, budget allocations, and resource management by offering clear data on how your community compares to its peers.
Monitor long-term trends
By tracking your community’s progress over time relative to similar communities, you can assess the impact of new initiatives and adjust strategies to ensure continued success.
Why you need Comparison Groups
Communities can’t improve what they don’t measure. Comparison Groups within Community Analytics give your city or agency the context it needs to understand where it stands on key metrics of success. By comparing your performance to similar communities, you can identify gaps, celebrate strengths, and make data-driven decisions that lead to better outcomes. The ability to customize your peer groups and access reliable, standardized data means that you’ll always have a clear picture of how your community performs relative to others.
Tracking long-term trends through historical data also ensures that you remain responsive to changes and can continuously refine your strategies. Whether you’re looking to improve resident satisfaction, allocate resources more effectively, or simply understand how your community measures up, Comparison Groups provide the insights you need to succeed.


