What is the CLS?
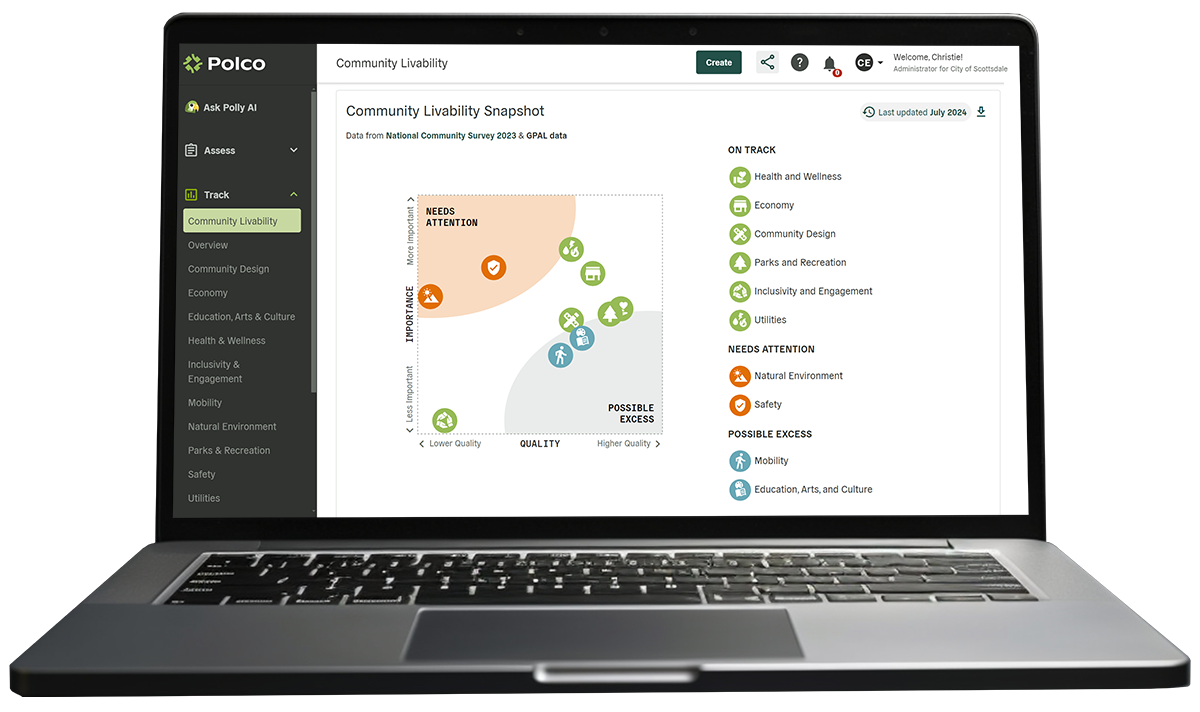
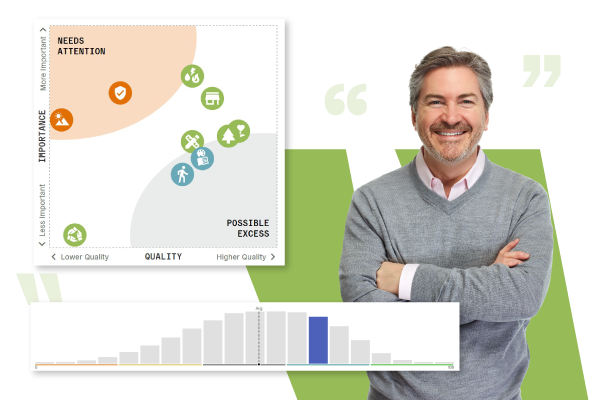
Polco's CLS translates data into actionable insights, providing local governments with a clear snapshot of community strengths and areas needing attention. By synthesizing data from surveys, national benchmarks, and Polco’s proprietary data, the CLS provides a visual representation of key community domains, such as safety, economy, inclusivity, and public services. These domains are plotted on a dynamic graph that balances their relative importance and quality, enabling leaders to identify gaps and opportunities for improvement.

Robust features of the CLS
From interactive data visualization to personalized insights, the CLS is packed with features that drive informed decision-making.
The CLS is designed to provide a comprehensive view of your community’s strengths and areas for improvement. These features go beyond basic data visualization, offering actionable insights and deep technical integration with Polco’s full platform. Here's a detailed look at the key features that make the CLS a must-have tool for data-driven community management:
Dynamic data visualization
At the heart of the CLS is an interactive and responsive graph that plots ten core community livability domains on two axes—quality and importance. This isn’t just a static chart; it evolves as new data is incorporated.
Clicking on any domain provides direct links to related community data points in Track, such as historical trends, national comparisons, and changes in community priorities over time.
Ten core livability domains
The CLS evaluates ten critical domains of community livability, each tailored to give detailed insights into areas vital to public service and community engagement. These domains reflect key areas of civic infrastructure and social well-being, providing a complete snapshot of your community’s health.
Each domain comes with metrics that are tailored to your community's unique challenges and resources, allowing for an evidence-based approach to local governance.
Seamless integration with other Polco Tools
The CLS is part of the broader Polco ecosystem, which includes powerful engagement and data analysis tools designed to help governments collect, analyze, and act on public input.
Government Performance Action and Learning (GPAL) feeds rich, publicly available datasets into the CLS, offering enhanced insights without the need for additional surveys. GPAL covers areas such as housing, crime statistics, and public utilities.
The CLS integrates seamlessly with Polco’s Domain Dashboards, which offer in-depth analysis of community metrics across various sectors. You can dive deeper into any domain tracked in the CLS through the Track Dashboards, gaining a more granular understanding of trends and performance indicators.
Data you can act on: Why the CLS is invaluable
From prioritizing resources to improving services, the CLS delivers actionable insights that transform decision-making.
Prioritize effectively
Visualize which services are high in importance but low in perceived quality, enabling targeted improvements where they’re most needed.
Data-driven decisions
Align your strategy with data and benchmarked performance metrics.
Enhanced resource allocation
Optimize budgets by identifying areas of overperformance and underperformance.
Actionable insights
Get direct recommendations for addressing areas that need attention through integrated Polco tools.
Why you need the CLS
The CLS doesn’t just provide data; it helps you understand what’s important and where you need to act to build a thriving community.
The CLS is essential for any government looking to improve transparency, community satisfaction, and service efficiency. By pinpointing areas where services fall short of expectations, the CLS helps prioritize what matters most.


