What is the Overview Dashboard?
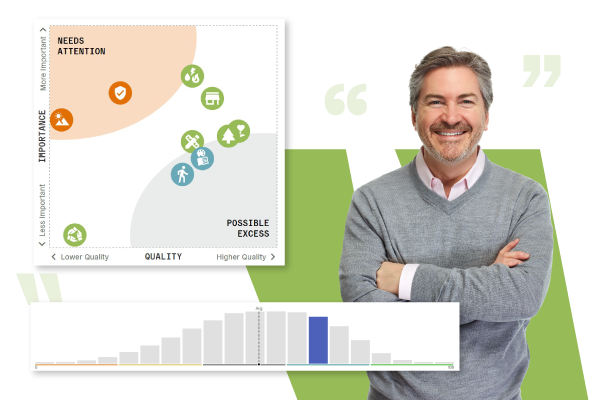
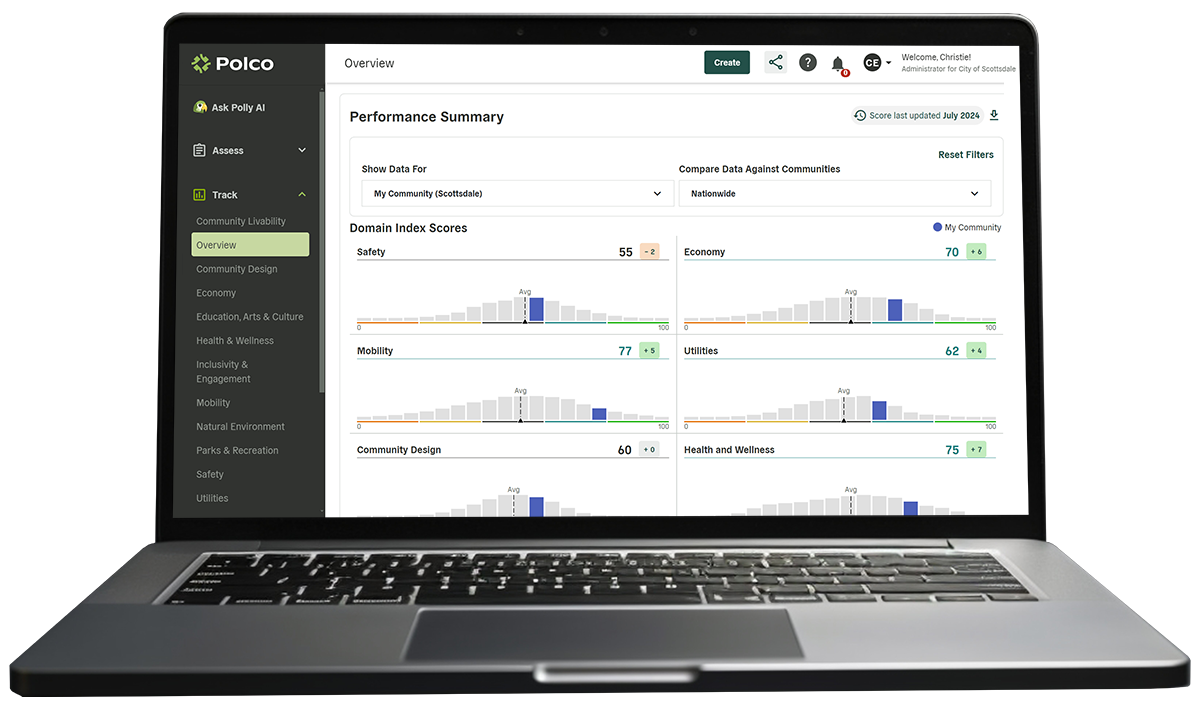
The Overview Dashboard is a core feature within Polco’s Track module, providing a unified and visual presentation of key data that reflects the health and performance of your community. It consolidates data from multiple sources, including benchmark surveys offering a high-level view of trends and performance metrics. Local leaders can easily track progress on key community issues, identify patterns, and focus on the areas that matter most to their constituents. The Overview Dashboard is designed to turn data into actionable insights for more informed governance and impactful decision-making.
Why you need the Overview Dashboard
Drive better outcomes with Centralize Data for Informed Community Leadership
In today’s data-driven world, community leaders need more than just spreadsheets—they need tools that transform raw data into meaningful insights. The Overview Dashboard centralizes data from multiple sources, offering a cohesive and comprehensive view of your community’s health and performance.
This tool is essential for tracking progress toward strategic goals, identifying areas for improvement, and making evidence-based decisions. Whether you’re managing public safety initiatives or addressing housing concerns, the Overview Dashboard gives you the insight to lead with confidence and respond to your community's needs effectively.