What are the Domain Dashboards?
Specialized Dashboards for Specific Community Areas
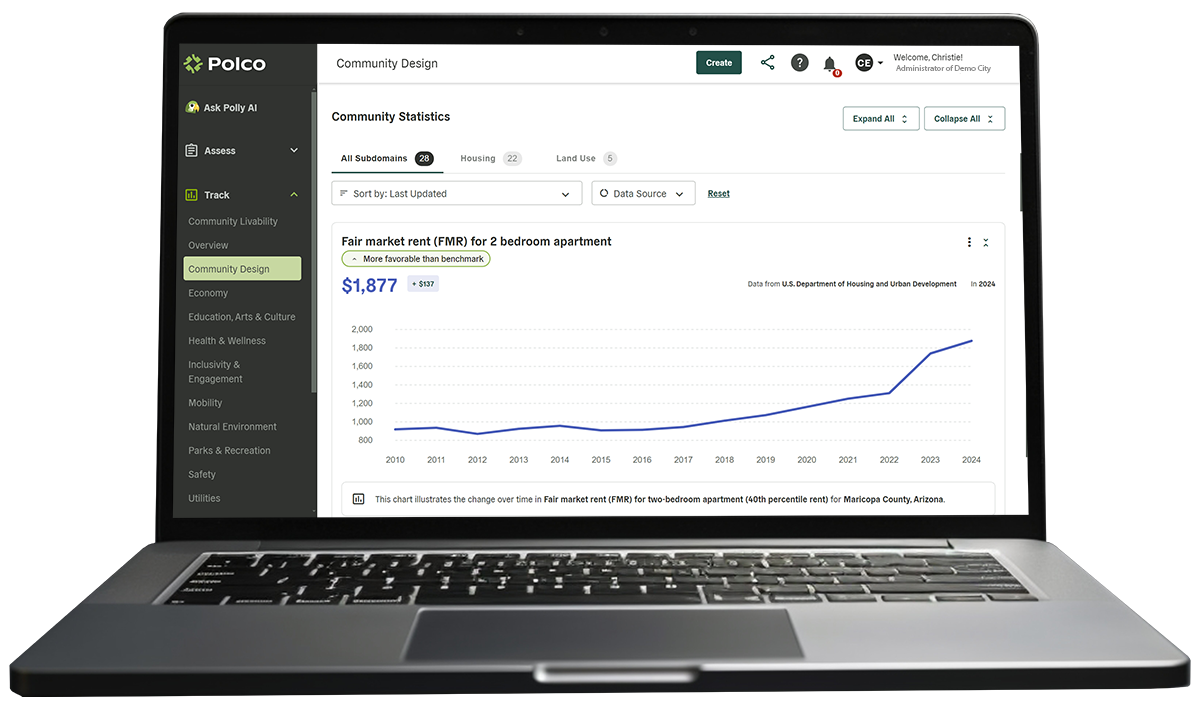
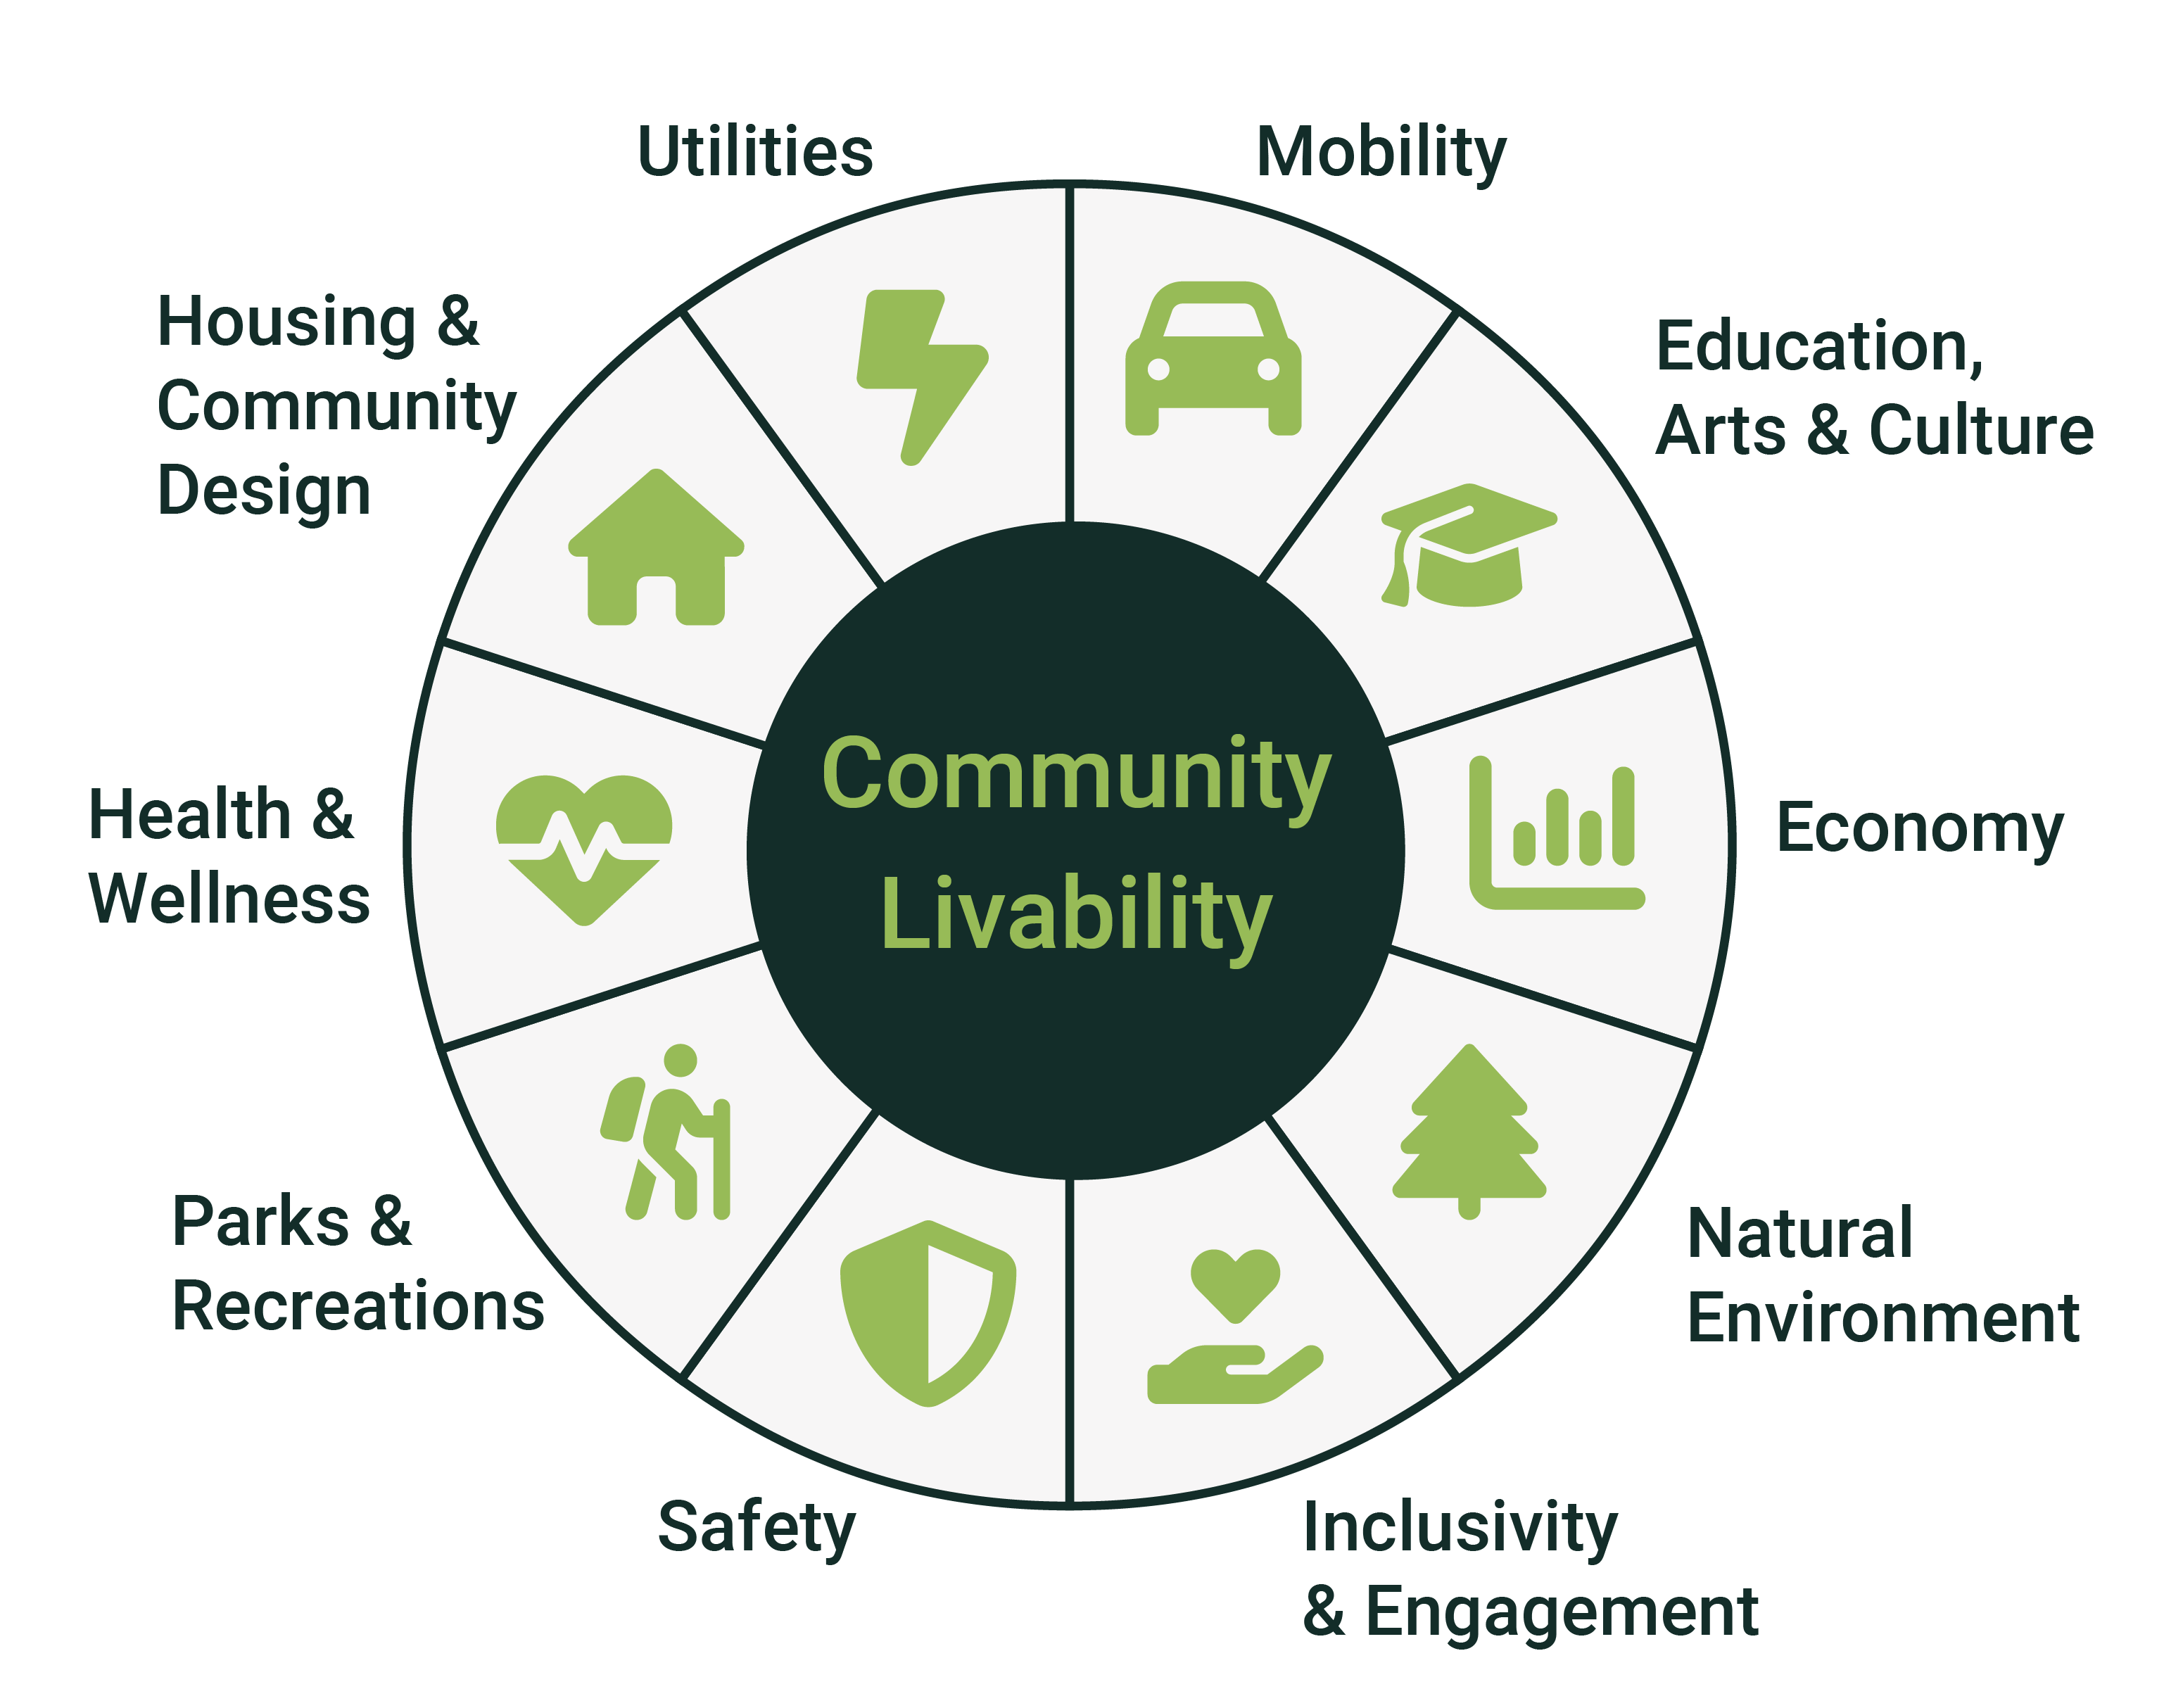
The Domain Dashboards within Polco’s Track module provide specialized views for different areas of community well-being, such as public safety, economic development, housing, and transportation. Each dashboard organizes critical data into specific domains, offering detailed insights into the factors that affect each area. These dashboards allow community leaders to dive deep into performance metrics, assess the impact of their policies, and make data-driven decisions to improve specific sectors of their community.

Focused features for deeper insight
Domain Dashboards deliver essential tools for domain-specific analysis.
Detailed domain-specific metrics
Each Domain Dashboard focuses on a specific area like public safety, transportation, or housing, offering comprehensive data relevant to that sector. You can monitor key performance indicators (KPIs) that directly relate to the domain's success.
Whether tracking crime rates, commute times, or housing affordability, these metrics provide insights that are crucial for understanding the challenges and opportunities in each domain. This domain-specific focus ensures that you get the most relevant and actionable data.
Historical trend analysis
Domain Dashboards offer access to historical data, allowing you to track long-term trends and shifts in key metrics. By comparing current data with past performance, you can assess the success of initiatives and identify emerging patterns that need attention.
Whether you're looking at multi-year trends in housing development or changes in public safety incidents, this feature gives you the historical context necessary for informed decision-making and long-term planning.
Sector-specific benchmarks
Each Domain Dashboard provides relevant benchmarks to measure your community's performance against national standards or similar communities.
By comparing your data with these benchmarks, you can understand how your community measures up in specific areas like transportation efficiency, public safety outcomes, or housing availability. These benchmarks serve as an important guide for setting realistic goals and understanding where you may need to allocate more resources or adjust strategies.
Key stakeholder reporting
Domain Dashboards make it easy to share insights with relevant stakeholders. Whether it's a housing commission, public safety team, or transportation department, you can provide sector-specific data that allows your stakeholders to stay informed and aligned with overall community goals.
You can embed data points in your website or other external applications and incorporate them in Polco Content Posts as well as save them as images to be incorporated in reports. The domain dashboards make it easy to offer focused data that help various departments and agencies collaborate on projects, stay updated on key metrics, and make decisions based on the same sets of information.
Experience the benefits of Domain Dashboards
Maximize the impact of data within critical community areas.
Better decision-making
Make well-informed decisions based on targeted data for each domain.
Improved communication
Share meaningful insights with stakeholders to ensure alignment and collaboration.
Focused insights
Gain clarity on specific sectors like public safety or housing.
Holistic view
Understand how various community factors interconnect and influence one another.
Long-term tracking
Track progress and monitor trends with access to historical data.
Why you need the Domain Dashboards
Drive positive change with targeted insights across all areas of your community
Communities are complex, with multiple sectors contributing to overall well-being. The Domain Dashboards offer a focused look at critical areas like public safety, housing, transportation, and economic development, providing the insights needed to address specific challenges and opportunities. By utilizing detailed data and cross-comparing domains, you can see how one aspect of community life impacts another.
Whether you're tracking housing affordability, analyzing crime rates, or measuring economic growth, Domain Dashboards give you the clarity needed to take action where it matters most. Stay ahead of the curve by understanding trends, tracking progress, and sharing insights with your team and stakeholders.


