
You have probably heard the term margin of error, particularly when election polling results are being reported. But what, exactly, does this mean?
Margin of error is a statistical term that refers to the precision or reliability of the survey findings, given that the entire population of interest was not surveyed (known as sampling error). The margin of error is measured as an “interval” around estimates from the survey, generally framed as a range of percentage points that would be consistent with the specific results observed. For example, we may say that a survey has a margin of error (or a level of precision) of plus or minus 5 percentage points.
There are two key parts to the calculation of the margin of error: the number of respondents and the level of confidence. As the number of respondents increases, the margin of error goes down; thus, the precision increases (the interval becomes smaller). The level of confidence refers to the probability that an estimate would be within a certain range.
Most commonly, a 95% confidence level is used; this means that if a survey was conducted 100 times using the same methods, 95 of those times, the results would be within the estimated range. The greater the confidence level, the larger the margin of error (the wider the interval around results), while the smaller the confidence level, the smaller the margin of error. So a margin of error calculated using a 90% confidence interval would be smaller because the estimate would only have to be within the range 90 times out of 100, while a margin of error calculated using a 98% confidence interval would be greater because the estimate would have to be within the range 98 times out of 100. In practice, you will often hear the margin of error referred to as the range the estimate would be within if the entire population were surveyed, and while this is not entirely correct, it is the practical effect.
For example, with 600 responses, the margin of error at a 95% level of confidence is plus or minus 4 percentage points. This means that, if 75% of residents rate a service as “excellent” or “good,” and if you conducted this survey 100 times with different random samples, in 95 of the 100 implementations, the proportion of respondents giving an excellent or good rating would be within the margin of error (i.e., between 71% and 79%). Practically speaking, we might say that if the entire community responded to this question, between 71% and 79% would rate the service as excellent or good. The table below shows the margin of error estimated with a 95% level of confidence for various numbers of respondents.
| Number of | Margin of Error |
| 50 | ±13.9% |
| 100 | ±9.8% |
| 150 | ±8.0% |
| 200 | ±6.9% |
| 400 | ±4.9% |
| 600 | ±4.0% |
| 1,000 | ±3.1% |
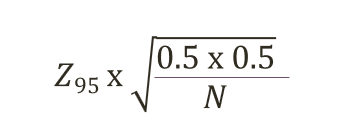
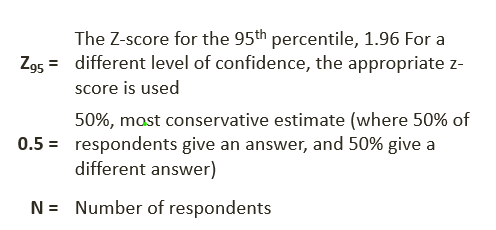
The formula for the calculation is:
It is important to note that the margin of error is only a measure of the “sampling error;” there are many other sources of error that can cause the results to be less accurate (that is, less representative of the entire population). It is commonly reported because this type of error can be easily quantified (we only need to know the number of respondents), but many other sources of error can be more problematic. For example, some selected survey recipients will decline participation in the survey (referred to as non-response error) and some eligible participants may be unintentionally excluded from the listed sources for the sample (referred to as coverage error).
Margin of error can only be calculated for probability-based sample surveys, where individuals invited to take the survey were randomly selected with a known probability from the total target population. When your respondents are not randomly sampled—like when you share a link to the survey across multiple communication channels, and all who see the invitation are welcome to opt-in and participate—other measures, such as credibility intervals, are used. The methods are complex, but practically speaking, the error bands are wider than a margin of error from a probability-based sample of a similar size.
You may not always need to measure the precision of your results, or, even if you do measure, you may be comfortable with less precision in some cases. Generally there are increasing costs to getting more precise results; higher-stakes decisions may warrant more investment than lower-stakes ones. In each case, you want to consider the tradeoffs of cost, timeliness and level of accuracy.
| More Precision Required:
| Less Precision Required:
|