Understanding Your Overall Results
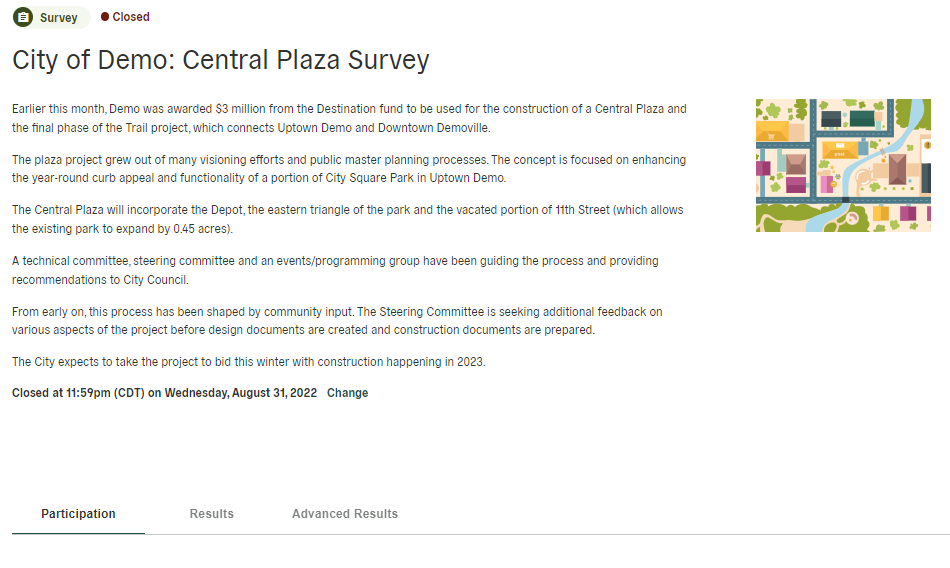
Once a survey has closed, you can click on the survey and scroll down to view the results. You’ll see three tabs: Participation, Results, and Advanced Results.
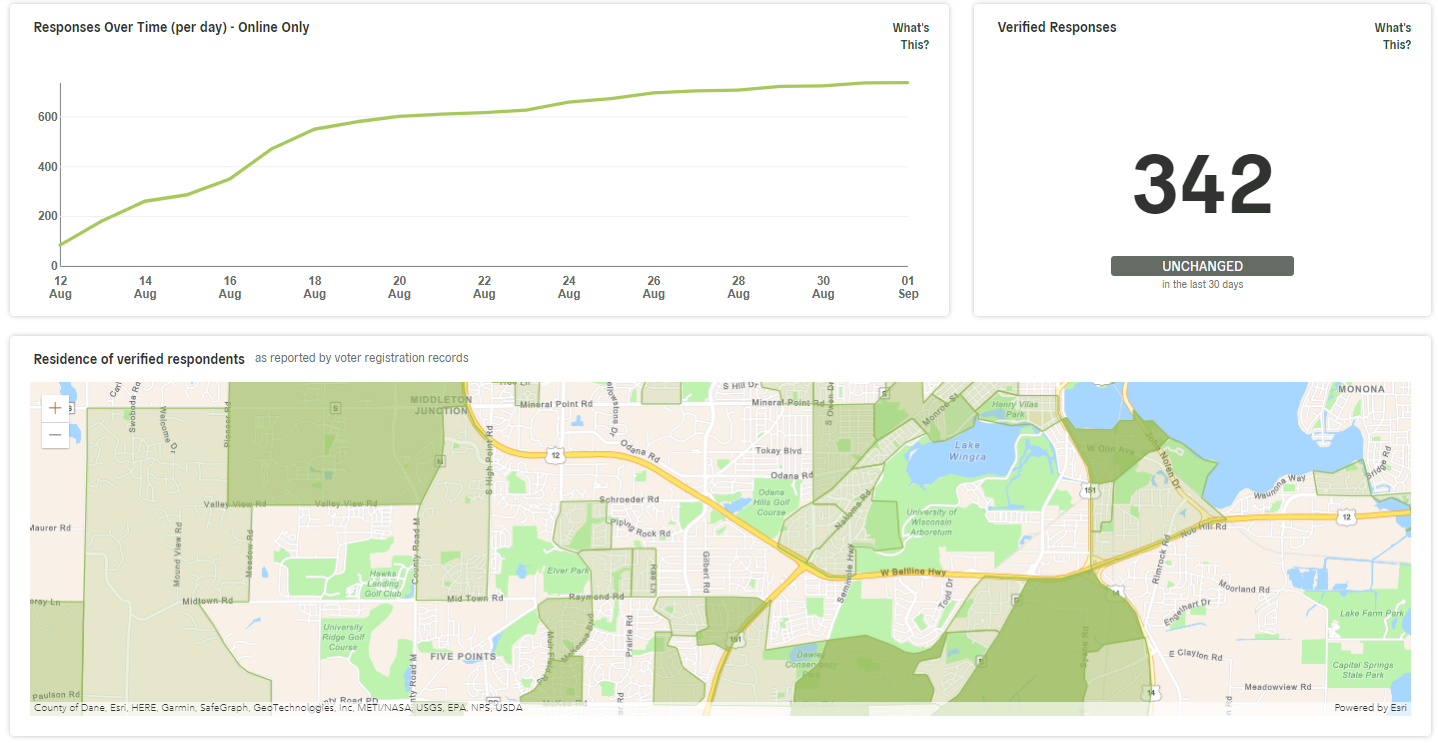
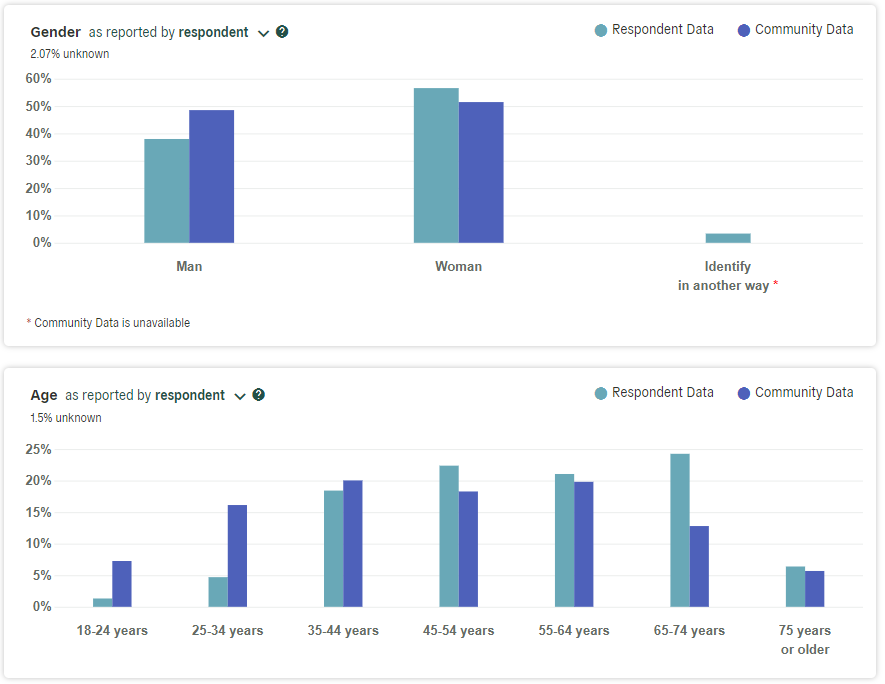
Under Participation, you’ll get an idea of the respondents to your survey, including responses over time, verified responses, representativeness by gender, age, and race, plus a map of respondents’ locations.
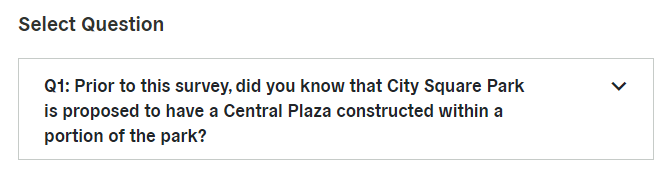
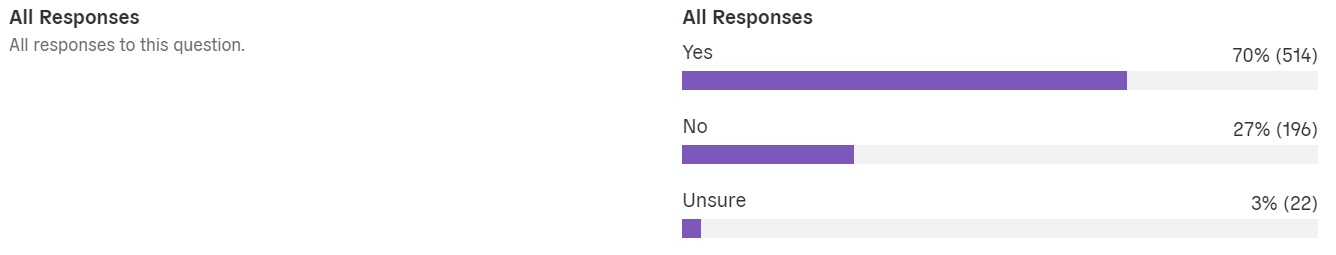
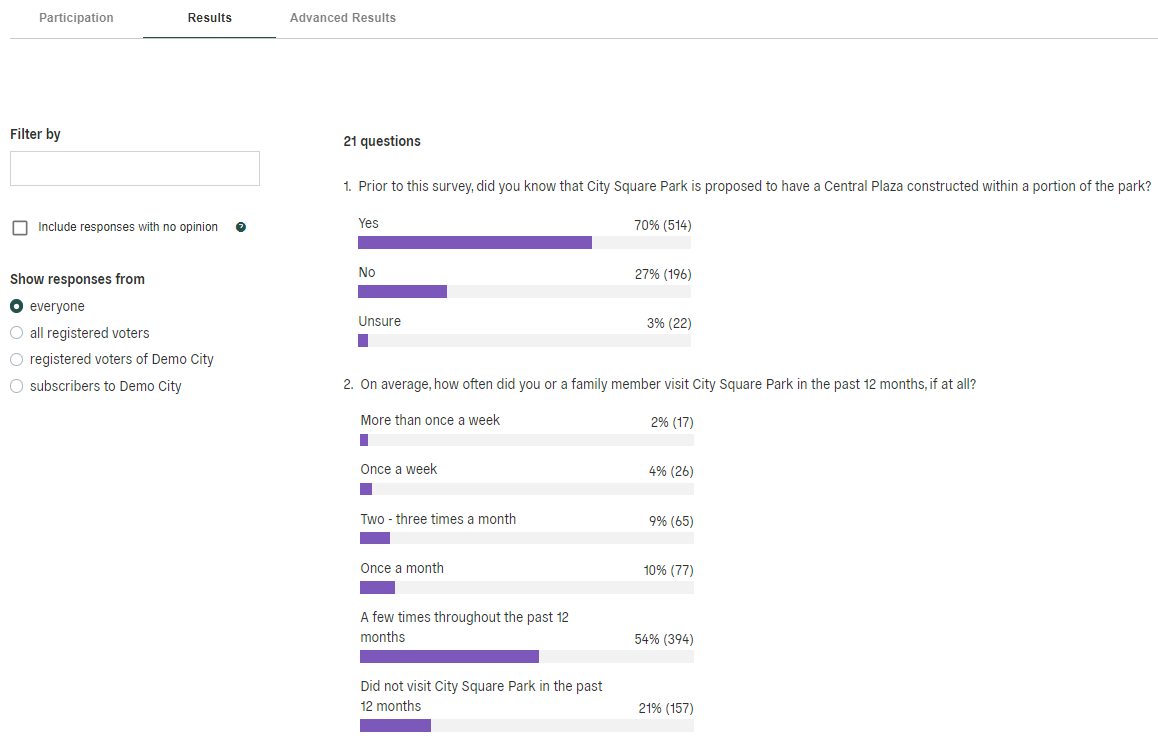
Under Results, you’ll find the results broken down by each question. This will help you understand high-level results for each question. You’ll also have the ability view responses from all participants or to show only responses from registered voters or subscribers to your Polco profile.
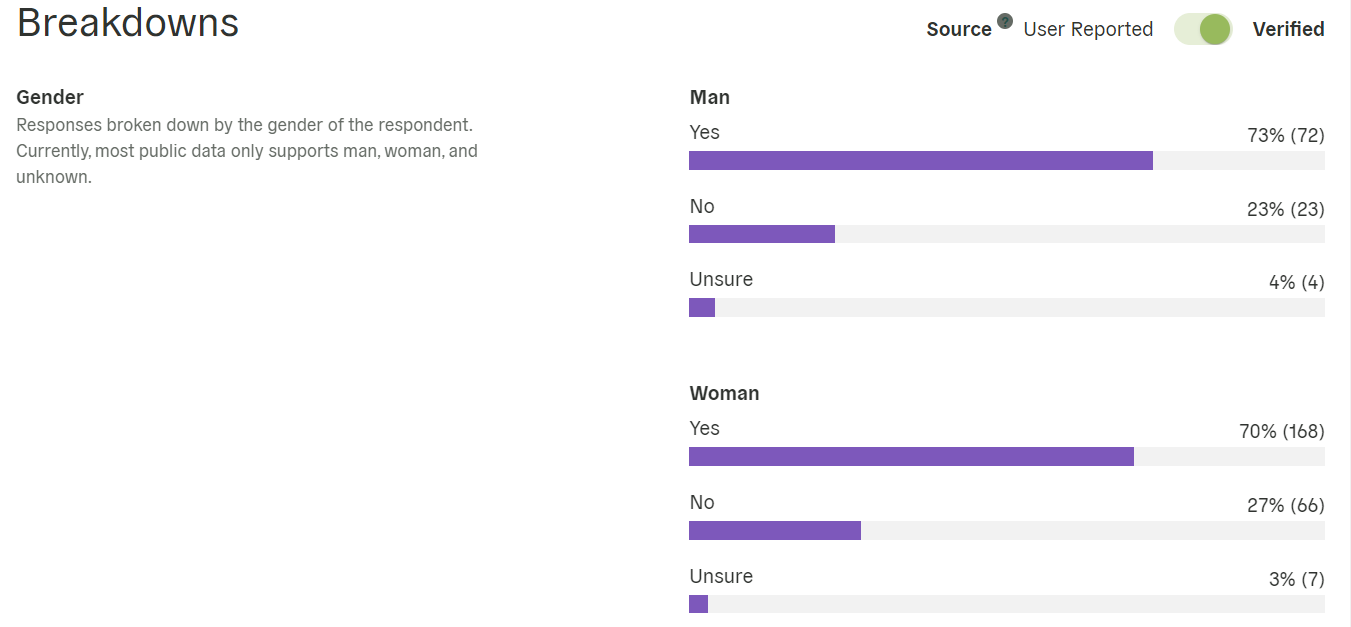
Under Advanced Results, you’ll see gender, age, and precinct (geographic area) breakdowns for each question. Viewing these breakdowns can show how specific demographics (age, gender, etc.) responded compared to other groups, allowing you to better understand how preferences and perceptions may differ within your community. For example, perhaps we expect a decision to disproportionately affect young women; using these breakdowns can ensure you have a strong understanding of their specific preferences. Use the dropdown menu at the top of the Advanced Results tab to filter by question, and scroll down to view each demographic breakdown.